In the complex world of monetary policy, one chart has gained almost legendary status among traders and economists the FED “dot plot.” Released quarterly as part of the Fed’s Summary of Economic Projections (SEP), the dot plot offers a rare glimpse into policymakers’ thinking about the future path of interest rates. For forex traders, it is a powerful tool for anticipating USD movements.
What Is the Fed Dot Plot?
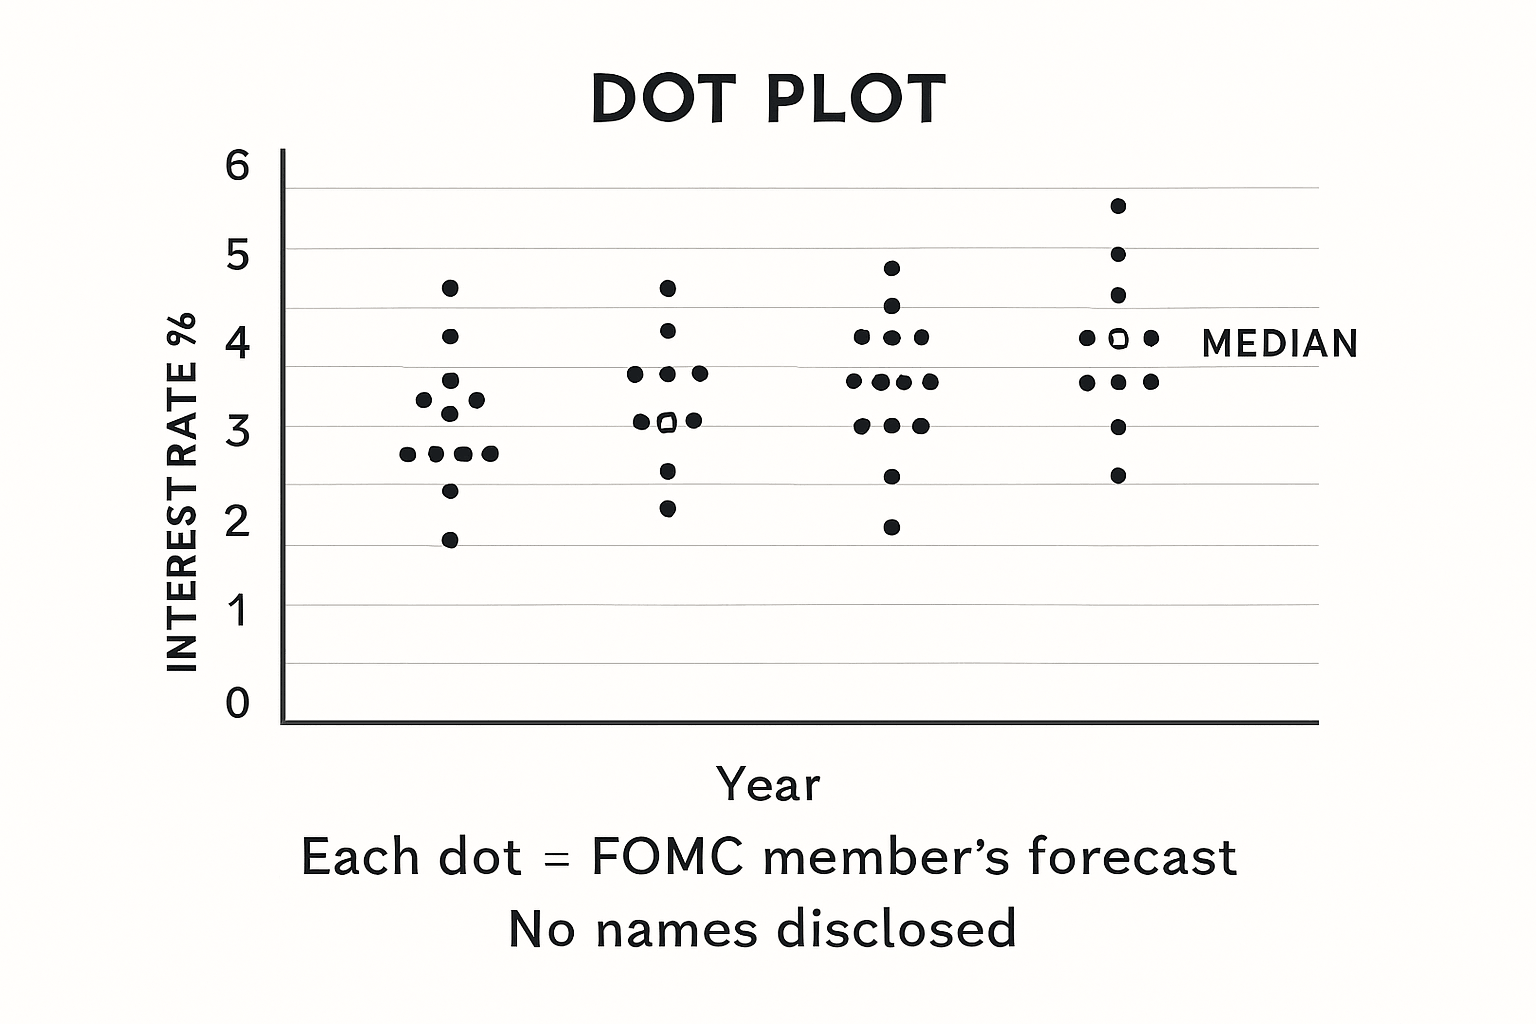
The dot plot is essentially a chart showing where each member of the Federal Open Market Committee (FOMC) believes interest rates should be at the end of each of the next few years, plus the “longer run.” Each policymaker’s view is represented by a single dot hence the name.
It’s important to note:
- The dots represent individual opinions, not a consensus forecast.
- The Fed does not identify which dot belongs to which member.
- Market participants often focus on the “median dot,” which represents the midpoint of all projections.
Why It Matters for USD Strength
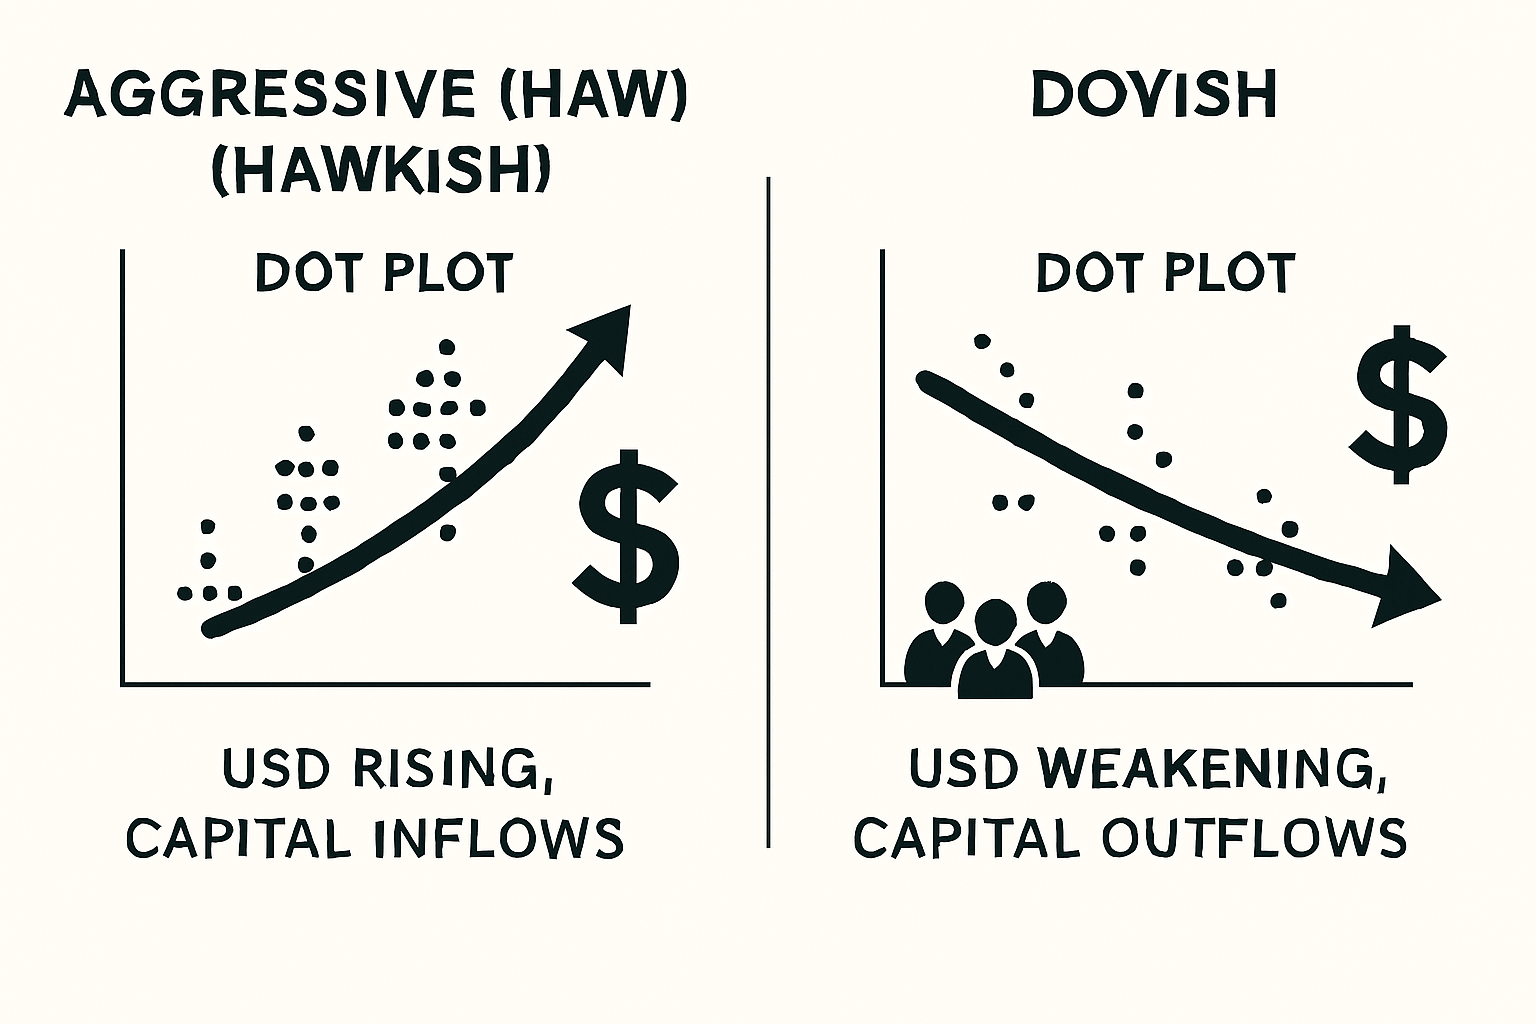
The value of the US dollar is heavily influenced by interest rate expectations. If the dot plot shows more aggressive rate hikes in the future, the market may anticipate higher yields on USD-denominated assets, boosting the dollar’s appeal. Conversely, if the dots suggest a slower pace of tightening or rate cuts, USD strength may weaken as investors seek higher returns elsewhere.
The connection works through:
- Interest Rate Differentials – Higher projected US rates compared to other economies tend to strengthen USD.
- Investor Sentiment – A hawkish dot plot can spark capital inflows into the US, while a dovish one may trigger outflows.
- Forward Guidance – The dots signal not just the current policy stance but the Fed’s future intentions.
How Traders Interpret the Dot Plot
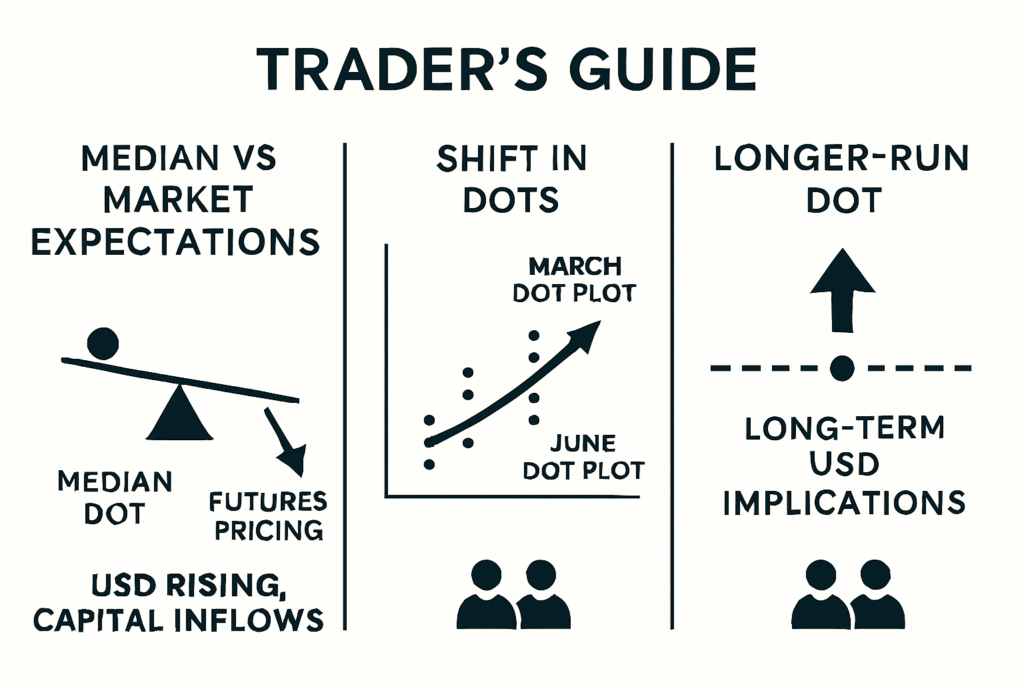
- Median vs. Market Expectations
Traders compare the median dot to what’s currently priced into futures and swaps markets. If the dots are more hawkish than market expectations, USD often rallies. - Shifts in the Dots
The most important insight comes from changes over time. A jump in the median dot between one quarter and the next can signal a more aggressive tightening cycle. - The Longer-Run Rate
This is the Fed’s view of the “neutral rate” the level at which policy is neither stimulating nor restraining the economy. Movements in this dot can influence long-term USD sentiment.
Real-World Examples of Dot Plot Impact
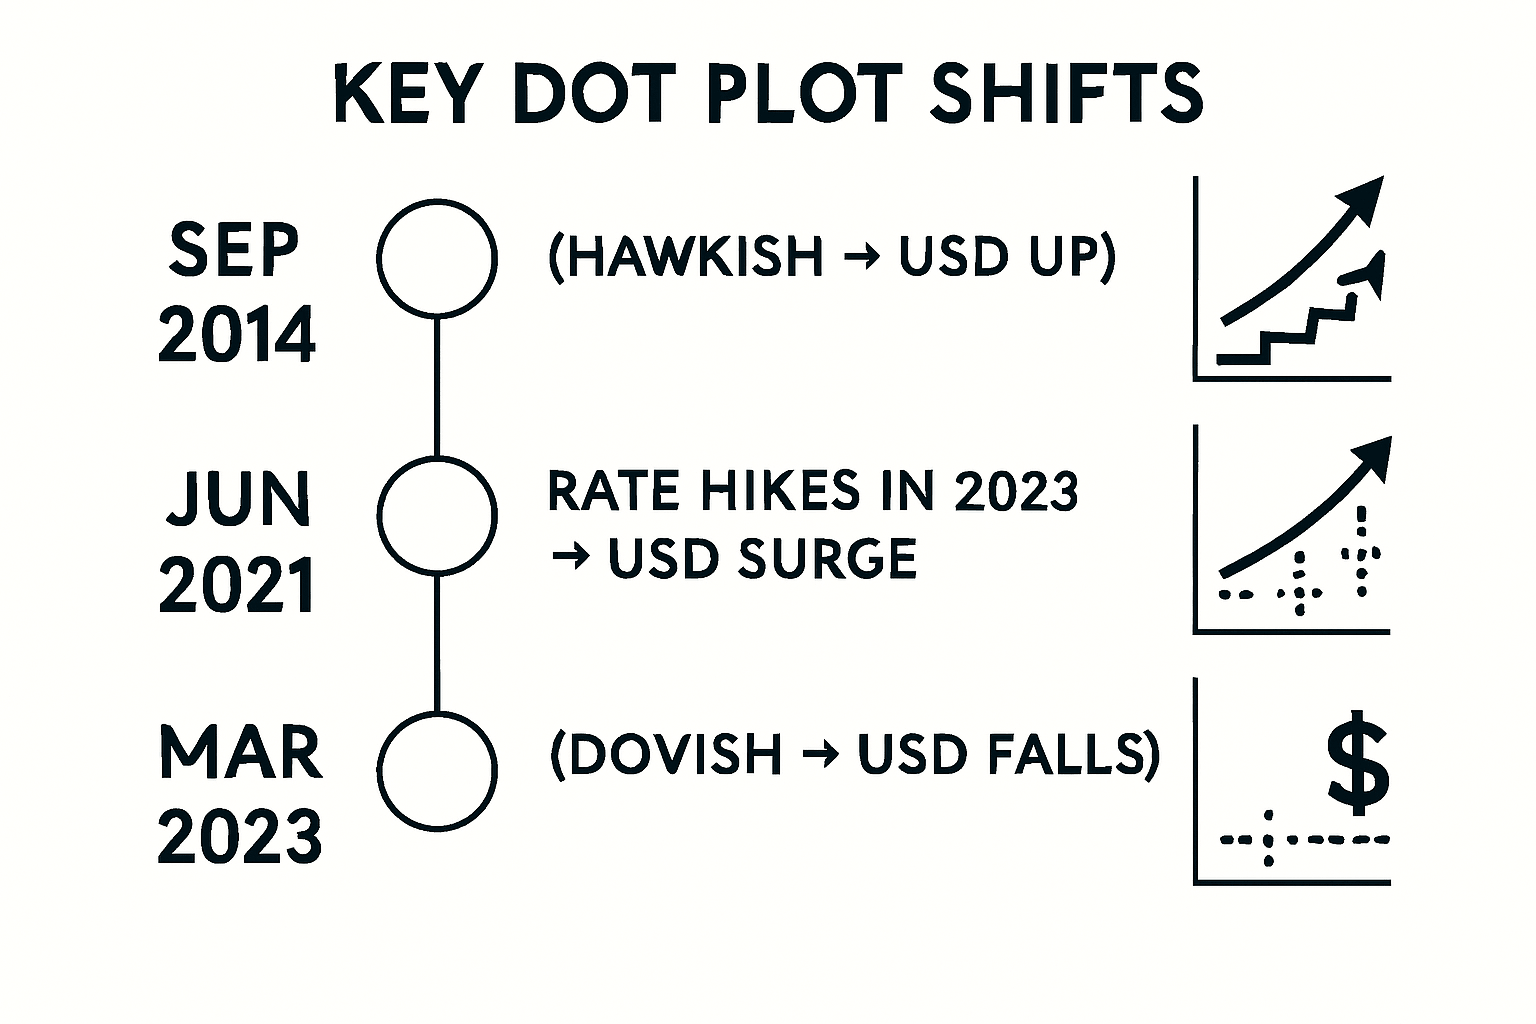
- September 2014: A hawkish shift in the dots boosted USD across the board as traders anticipated earlier-than-expected rate hikes.
- June 2021: The dot plot revealed more FOMC members expecting rate hikes in 2023, triggering a sharp USD rally.
- March 2023: A dovish adjustment, amid banking sector stress, weighed on USD as markets priced in a potential pause in tightening.
Trading Strategies Around the Dot Plot
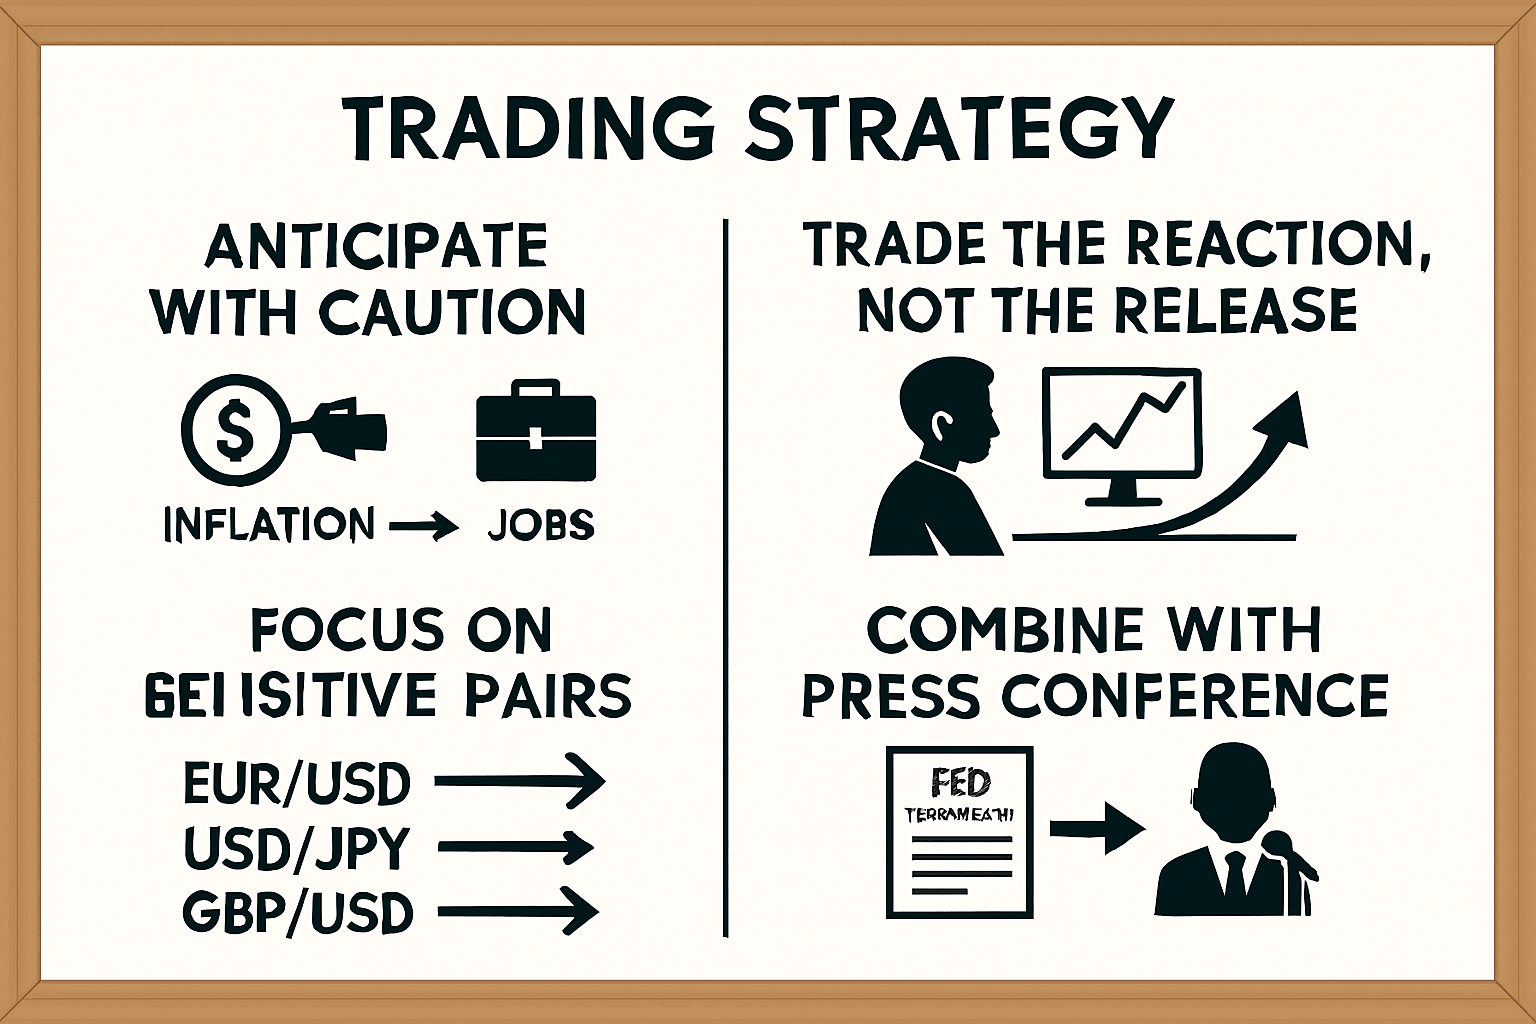
- Position Ahead with Caution
Some traders try to anticipate shifts in the dots based on economic data trends (e.g., inflation, jobs reports). This can be risky, as the dots can still surprise. - Trade the Reaction, Not the Release
Often, the first move after the dot plot release is emotional. Waiting for the market to settle can lead to more reliable trades. - Pair USD with Sensitive Counterparts
Currency pairs like EUR/USD, USD/JPY, and GBP/USD tend to react strongly to dot plot changes. - Integrate with Broader Fed Communication
The dot plot is released alongside the Fed statement and press conference. Traders should interpret it in the context of the overall message.
Limitations of the Dot Plot
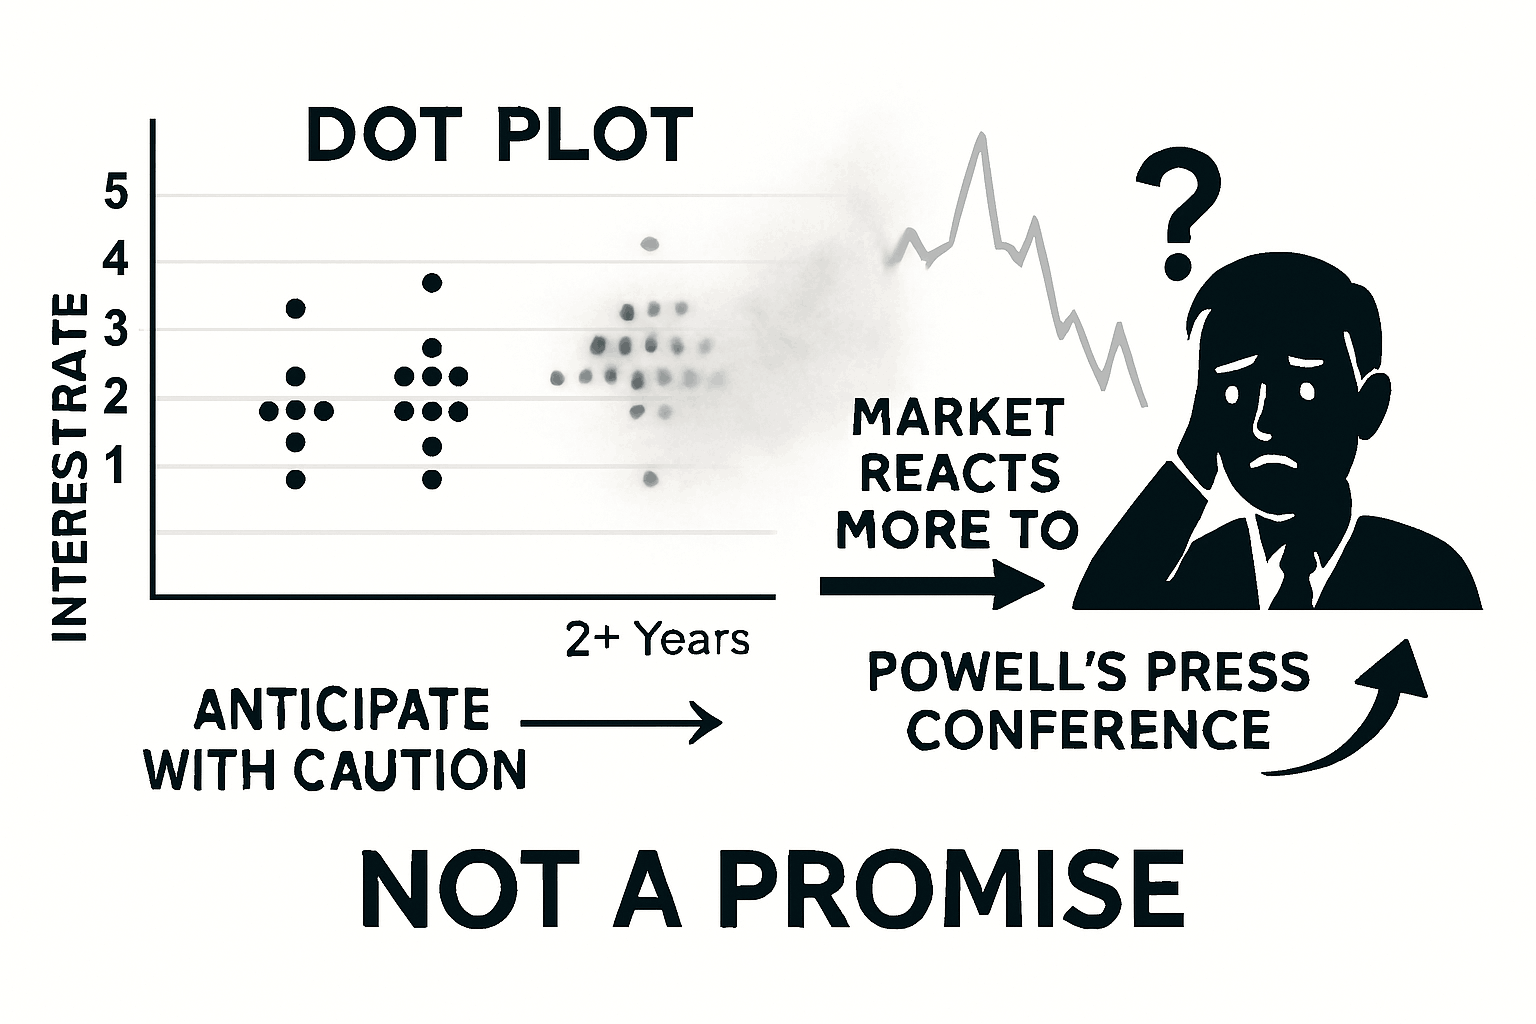
- Not a Promise – Dots reflect individual forecasts, which can change rapidly as conditions shift.
- Market Interpretation Can Differ – Sometimes the market focuses on other elements, such as inflation forecasts or Fed Chair comments.
- Long-Term Uncertainty – The further out the dots go, the less reliable they become.
Final Thoughts
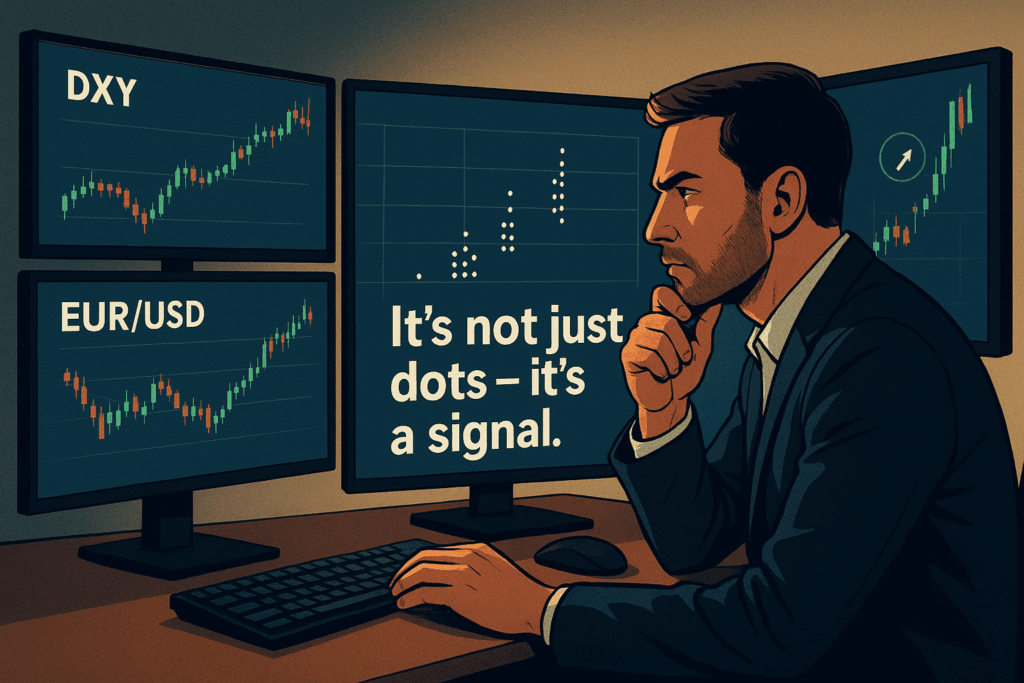
The Fed’s dot plot is not a crystal ball, but it is one of the most closely watched signals in global finance. For USD traders, it offers valuable insights into how policymakers see the path of interest rates and therefore the potential trajectory of the dollar. By understanding how to interpret shifts in the dots and integrating them with broader market analysis, traders can position themselves to better navigate the powerful forces that drive currency markets.